

Tenera Simulation Engine

Make better decisions on your product bets with a simulation engine that keeps learning.

Tenera learns from your historical clickstream data and simulates how customers respond to future changes. Test your product bets before building, compare predicted outcomes with observed behavior, and understand why through insights grounded in real evidence.

Book a demo
A branching journey from the homepage through pricing, feature details, signup and checkout to a welcome page. Each connection shows the action and its probability. Adding a simulated free-trial page redistributes Pricing paths from 36 and 64 percent to 24, 46, and 30 percent, while each page’s outgoing action probabilities total 100 percent. Incoming probabilities are conditional on their source pages. In this illustrative example, all visitors reach checkout. Subscription conversion is 40 percent for the current journey and 55 percent for the new bet; the remaining 60 and 45 percent leave checkout. These are example rates, not measured results.Incoming from Pricing: Explore, 36%. Outgoing to Sign up: Sign up, 100%Incoming from Sign up: Continue, 100%. Outgoing to Welcome: Subscribe, 40%. Outgoing to Left checkout: Leave checkout, 60%Incoming from Checkout: Leave checkout, 60%View plans72%Sign up28%Explore36%Choose plan64%Sign upContinueSubscribe40%Leave checkout60%
A branching journey from the homepage through pricing, feature details, signup and checkout to a welcome page. Each connection shows the action and its probability. Adding a simulated free-trial page redistributes Pricing paths from 36 and 64 percent to 24, 46, and 30 percent, while each page’s outgoing action probabilities total 100 percent. Incoming probabilities are conditional on their source pages. In this illustrative example, all visitors reach checkout. Subscription conversion is 40 percent for the current journey and 55 percent for the new bet; the remaining 60 and 45 percent leave checkout. These are example rates, not measured results.Outgoing to Pricing: View plans, 72%. Outgoing to Sign up: Sign up, 28%Incoming from Homepage: View plans, 72%. Outgoing to Feature details: Explore, 24%. Outgoing to Sign up: Choose plan, 46%. Outgoing to Free trial: Choose free trial, 30%Incoming from Homepage: Sign up, 28%. Incoming from Pricing: Choose plan, 46%. Incoming from Feature details: Sign up, 100%. Outgoing to Checkout: Continue, 100%Incoming from Checkout: Subscribe, 55%View plans72%Sign up28%Explore24%Choose plan46%Sign upContinueSubscribe55%Leave checkout45%Choose free trial30%Continue to checkoutIncoming from Pricing: Choose free trial, 30%. Outgoing to Checkout: Continue to checkout, 100%
Free-trial experiment
55%VS40%
Drag
75–90%

Similarity to human behavior, depending on data quality

100%

Success rate on outcome prediction so far across all clients

3–12 hrs

Turnaround time per decision

01 / Behavior journey map

See the future journey behind every product bet.

Follow customer actions across your product and see where the next decision branches.
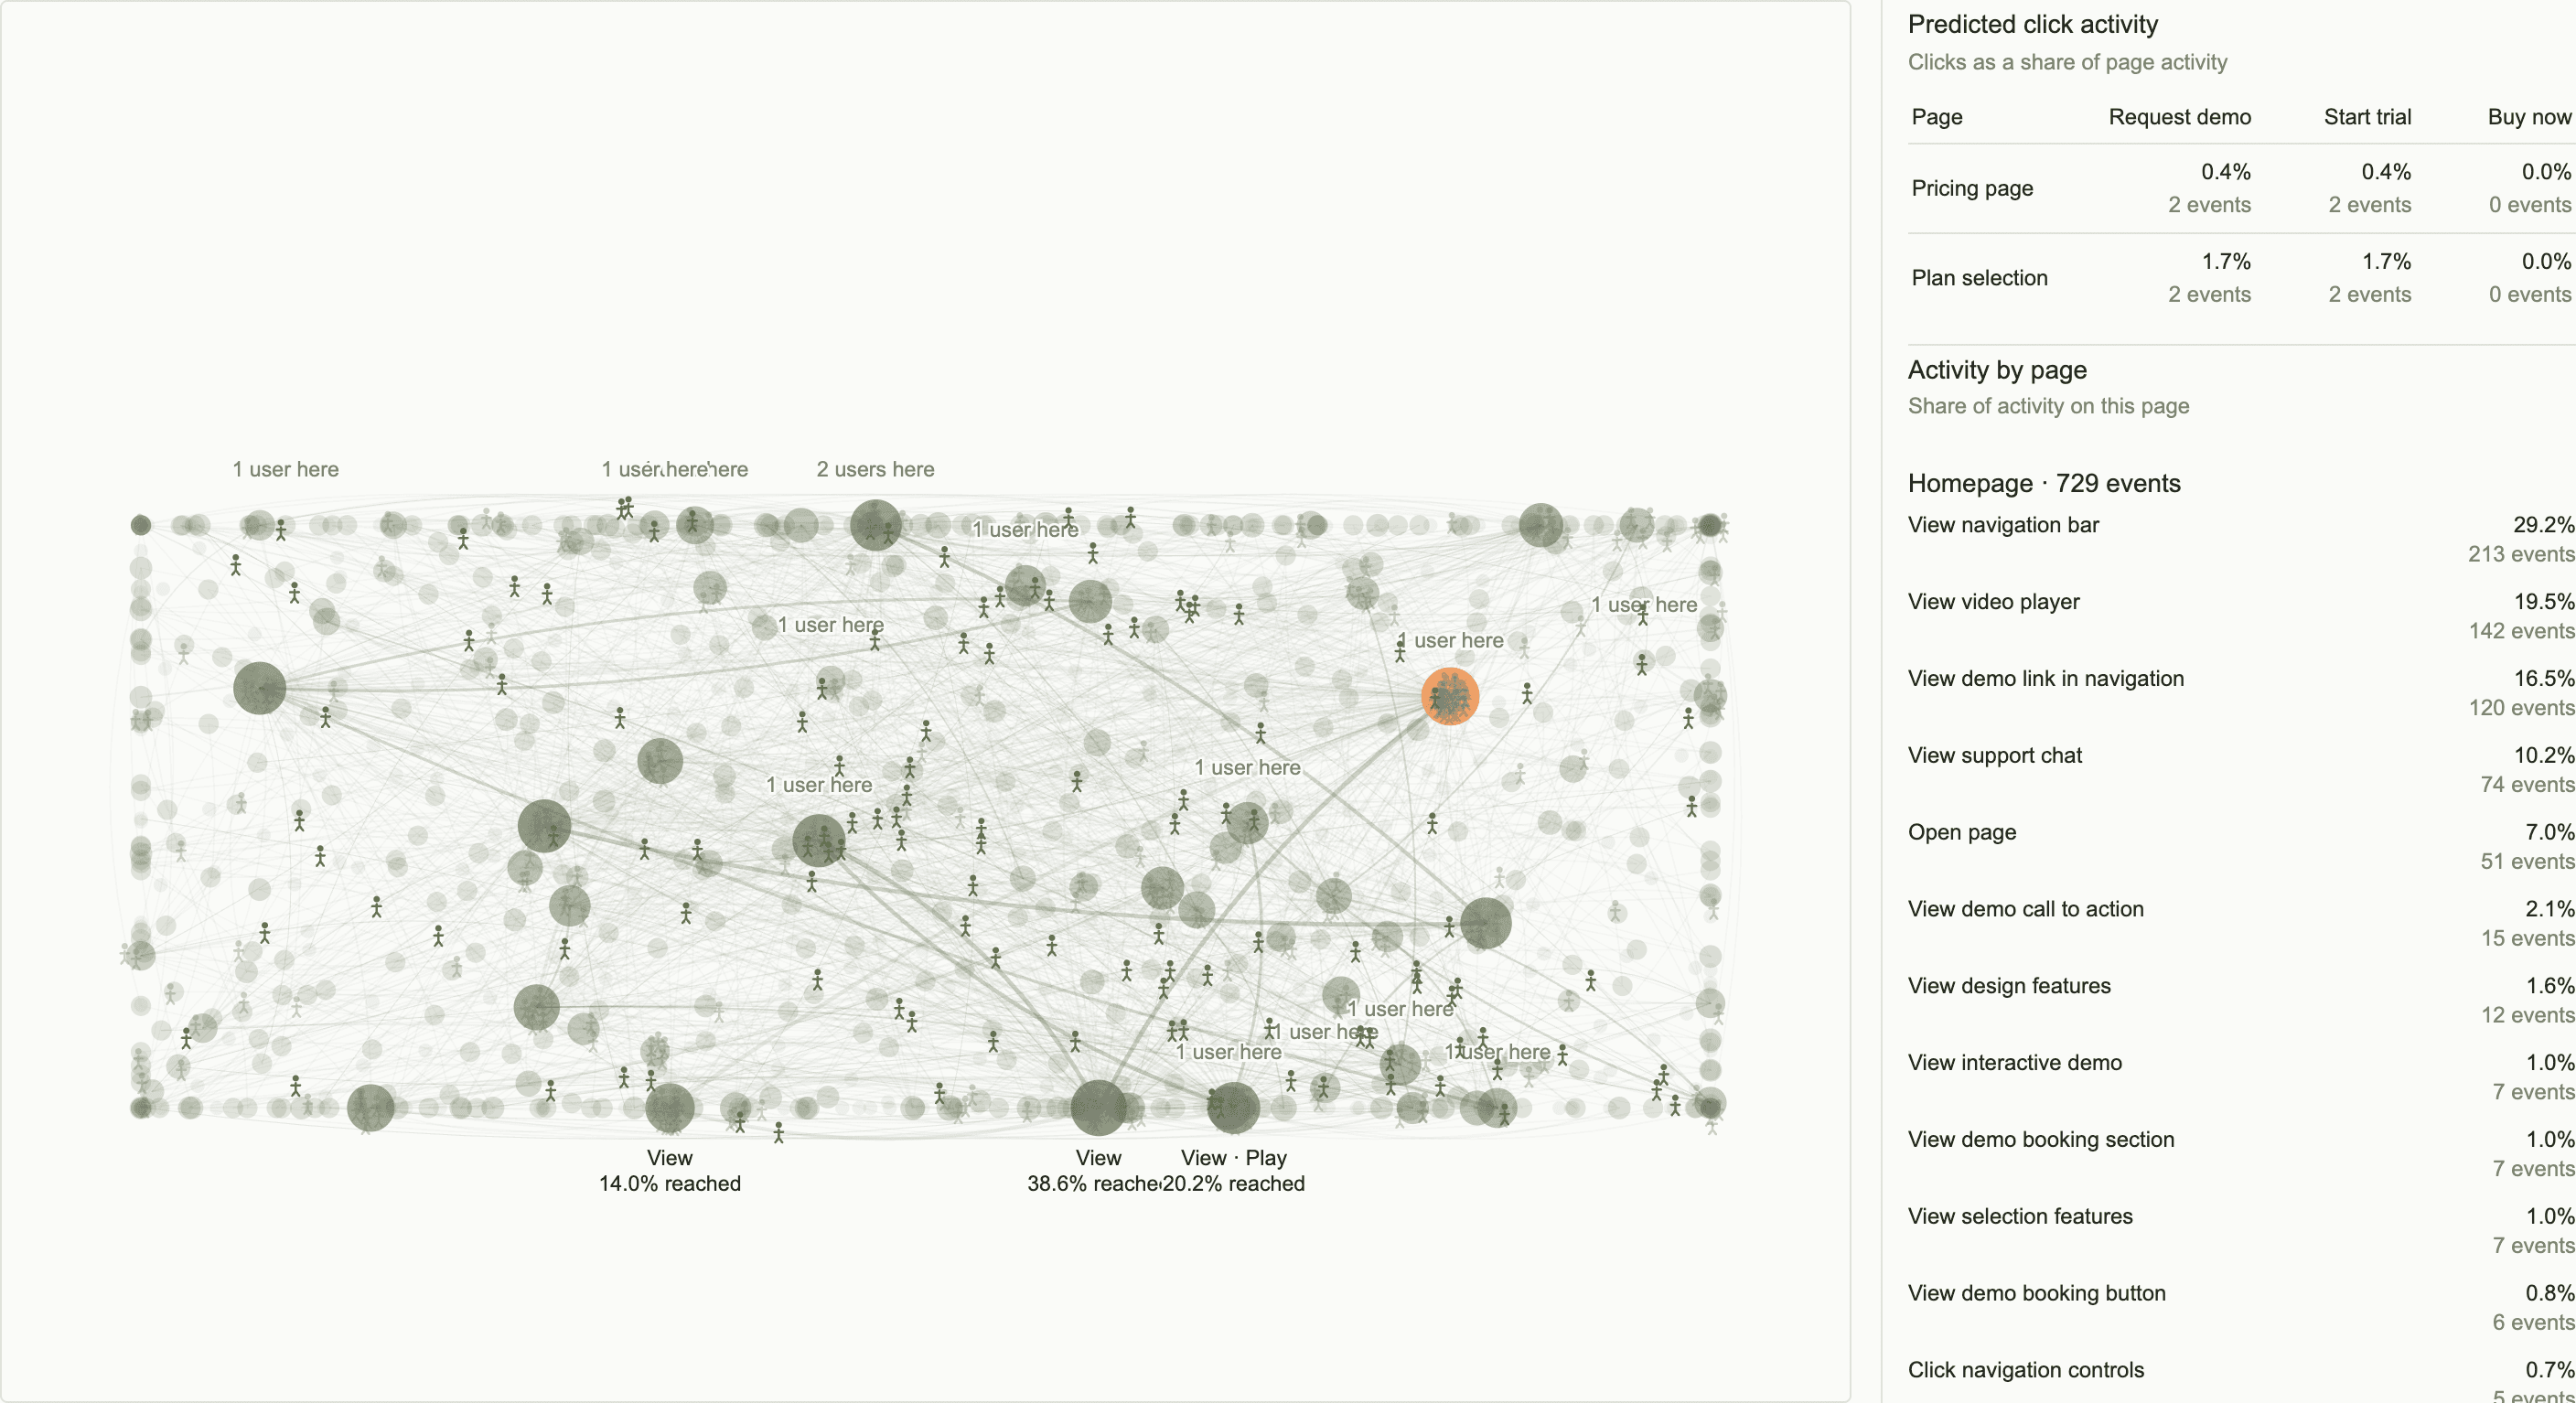
Simulated users moving between circular event nodes, alongside predicted click activity and activity by page.
02 / Explainable decisions

Know what will happen. Understand why.

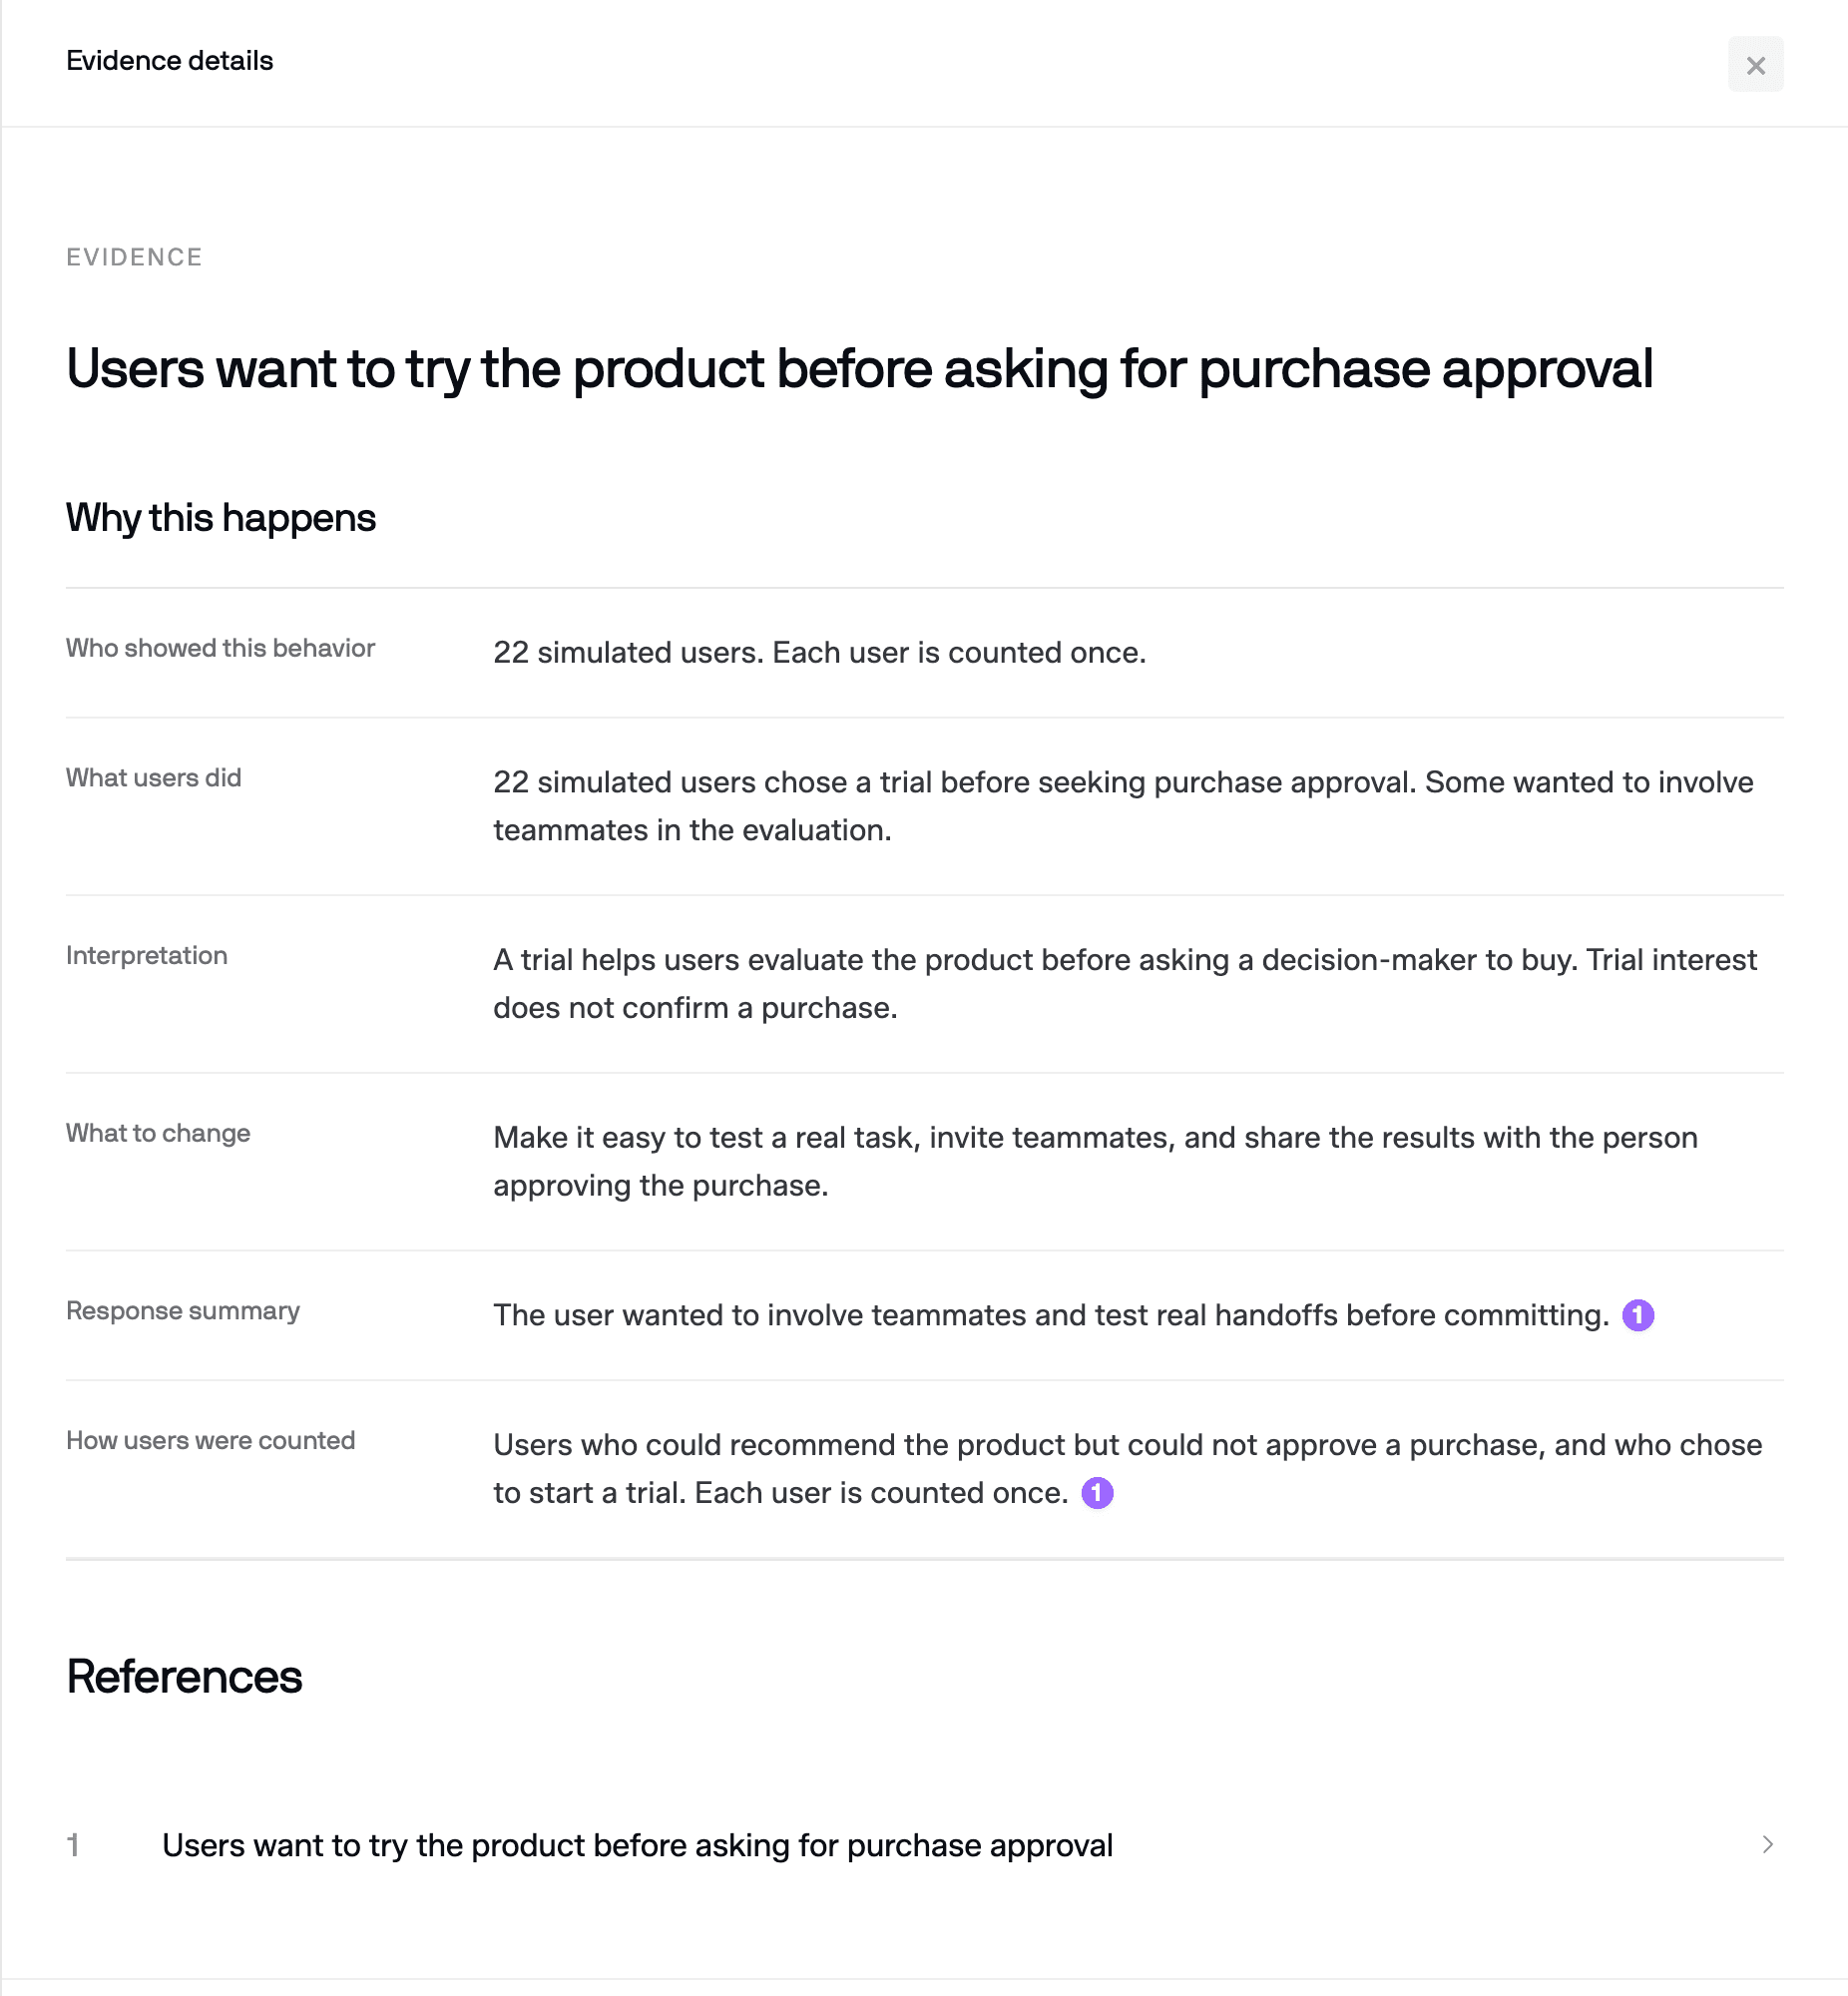
Compare predicted outcomes, then trace each insight back to the customer behavior and evidence behind it.
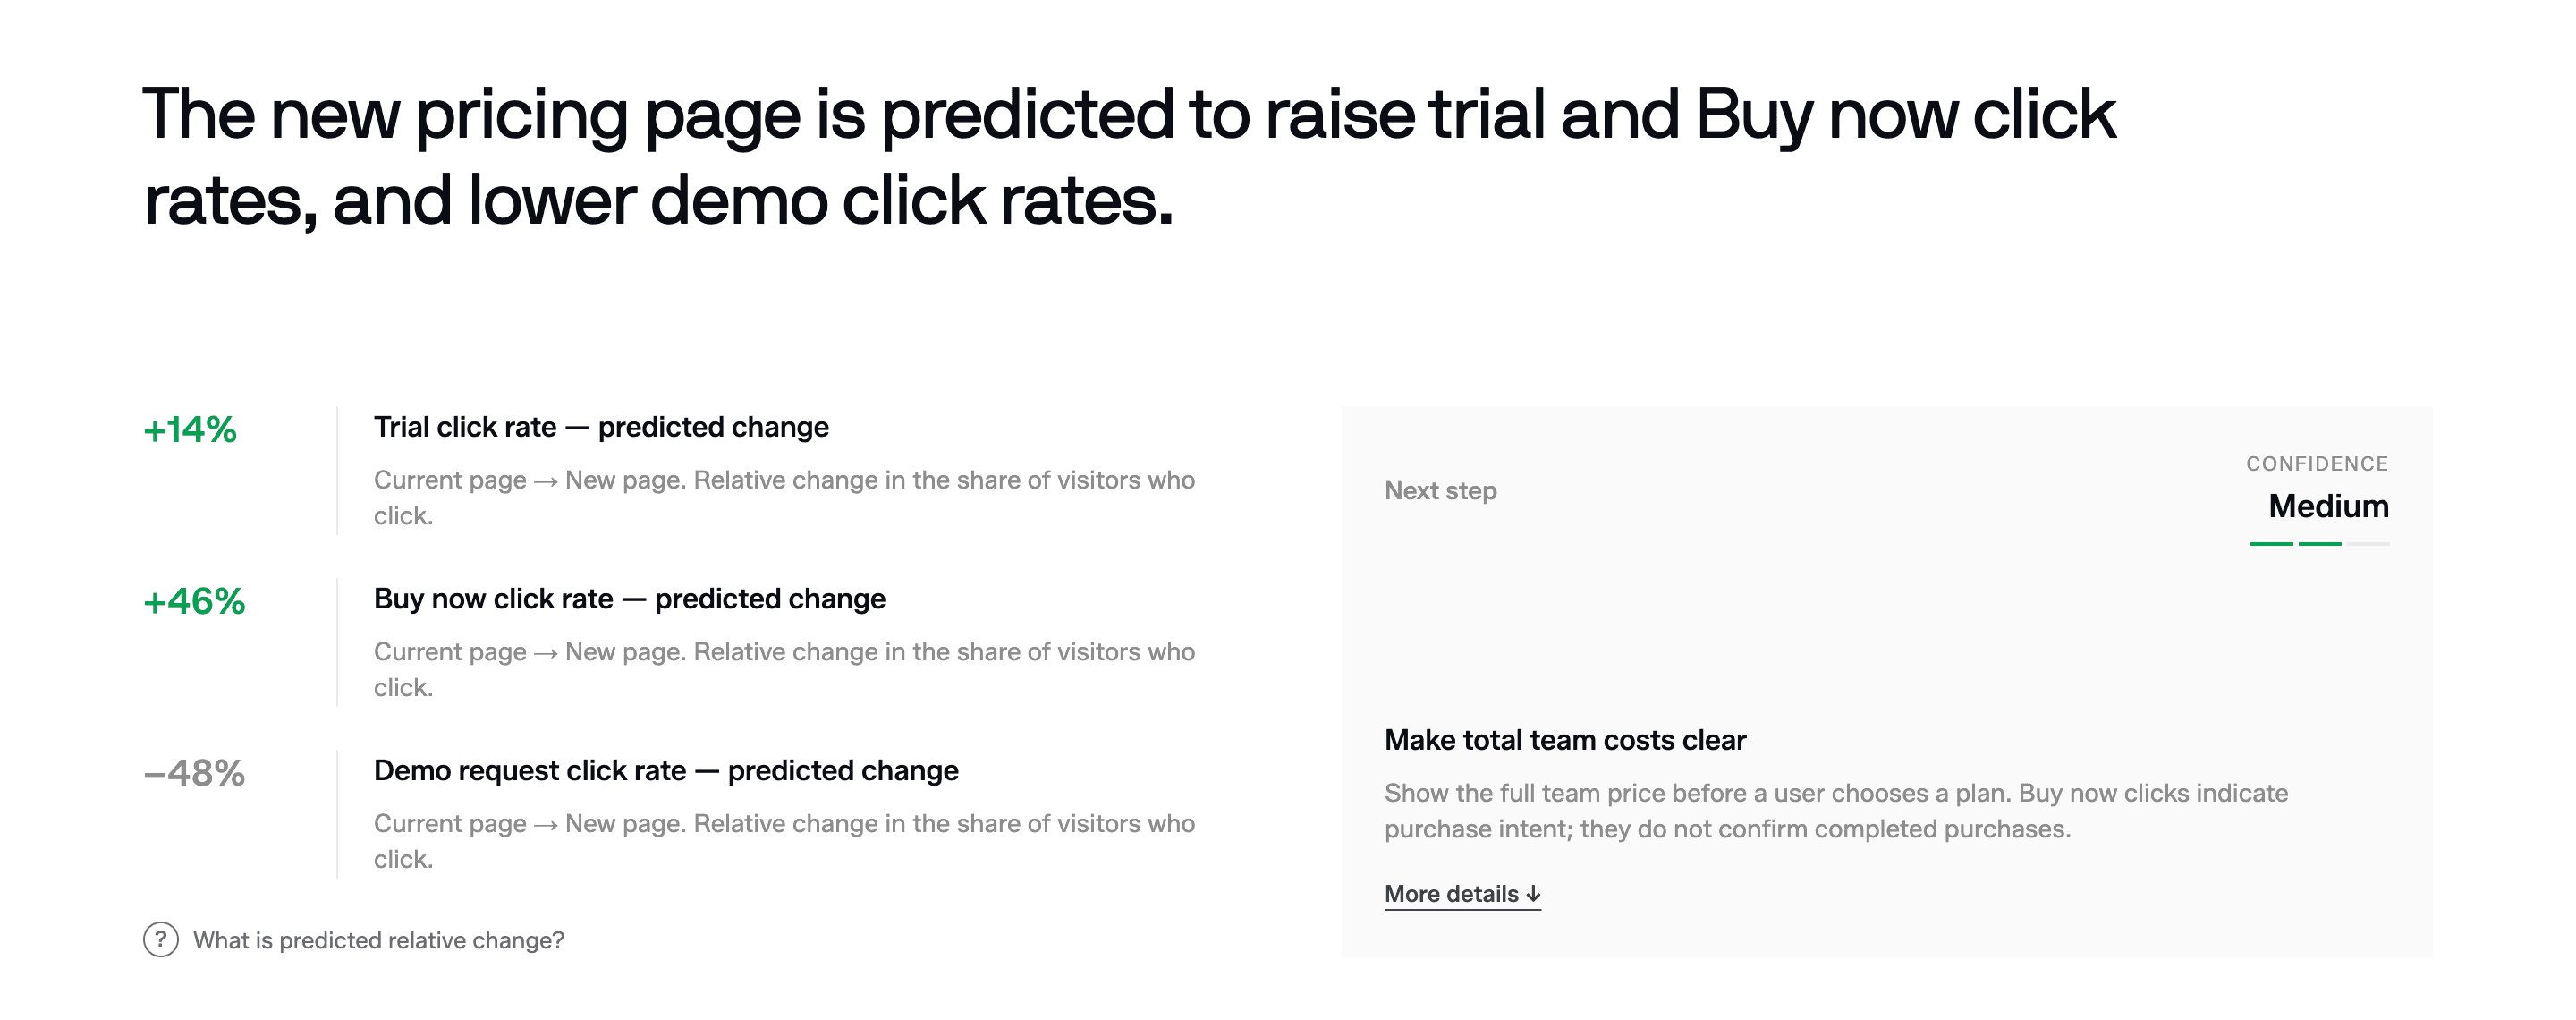
A product decision report comparing predicted trial, Buy now, and demo request click rates.
The evidence sidebar explains why users try a product before seeking purchase approval, with simulated behavior, interpretation, and a response summary.